
Visualize Your Data Through SAP Lumira
Managing huge amount of data is very tedious and critical task for any organization. Designing the data that make more sense and generate valuable output for any small, medium or large size enterprises will help mitigate this issue. It helps organizations focus on the important and desirable data.
Data visualization is becoming increasingly important to manage the massive amount of data, so as to make more informed decisions. This input will also give critical business information related to customers and partners to the end users, as well as changing behavior and trends for the different sectors like retail, manufacturing, wholesale etc.
Business Intelligence is neither a system nor a product; it just includes application, architectures and datasets. BI analyzes historical data – the data generated through business transactions or by other business activities. It helps analyze the past and present business performance and critical situations for better business decisions.
For this purpose, SAP enhanced their Visual Intelligence with the help of a tool called SAP Lumira. This suits the self service data visualization and business intelligence applications required by enterprise users.
SAP Lumira
SAP Lumira allows businesses to visualize access and manage the humungous data. The tool offers a simple user interface, thus creating beautiful visualizations, which allows users to analyze data without any impediments. You can select data visualization from multiple sources (CSV file, SAP HANA, MS Excel, Freehand SQL, SAP business objects universe) with simple drag and drop steps with this interface. You can even create data source with this tool. Using SAP Lumira, analysts can alter data structures and correlations in any way they want, without the help of IT department, and then push the data back into the system. This way it can be consumed by more casual users with the help of tools like Business Explorer. It can be also connected with SAP HANA in offline and real time connection.
SAP Lumira Abilities
- Grow your business by integrating wide-scale insights and drill-down granular details
- Share details efficiently and effectively with people across the organization
- Quick decisions visualizing huge amount of fact based solutions to intricate business questions by avoiding list tables and fixed format reports
- Enable self-service data usage without decreasing dependencies on the IT department
- Deliver significant analytics and reporting
Market Position
- SAP Lumira gives swiftly, most engaging ways to get answers from your data
- It is definitely one of the best data visualization tools you can find in the market
SAP Lumira with Secure Cloud Environment
SAP Lumira Cloud permits users to use self service Business Intelligence in secure cloud environment accessing, visualizing and sharing data without the need of IT Department. SAP Lumira Cloud helps improve efficiency reduces the time as well as the cost of infrastructure.Visualizing Data
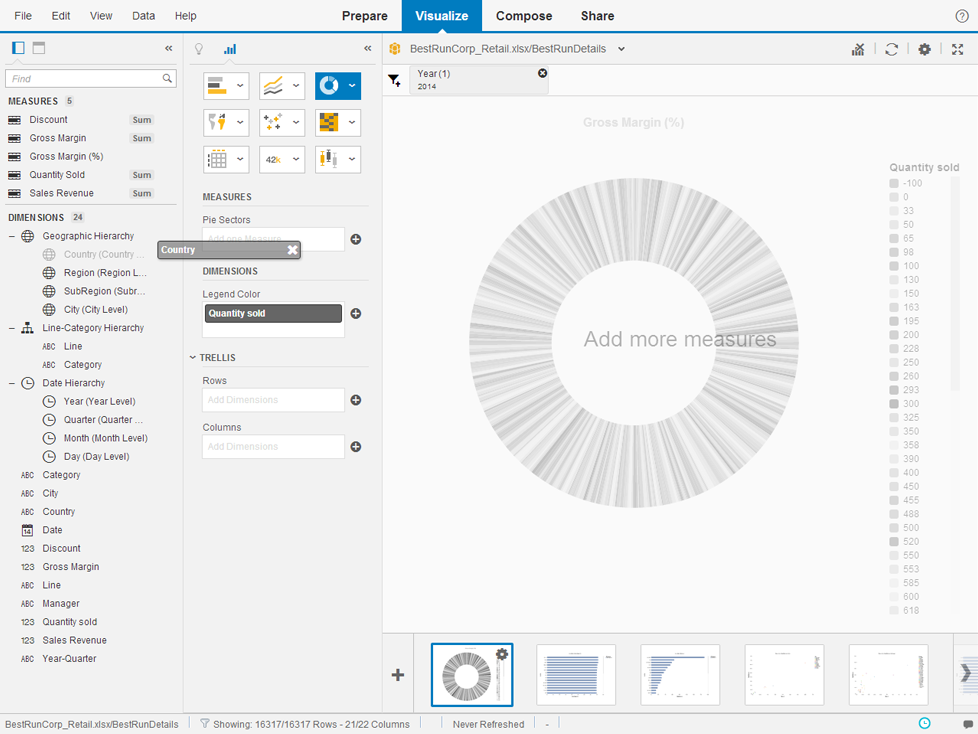
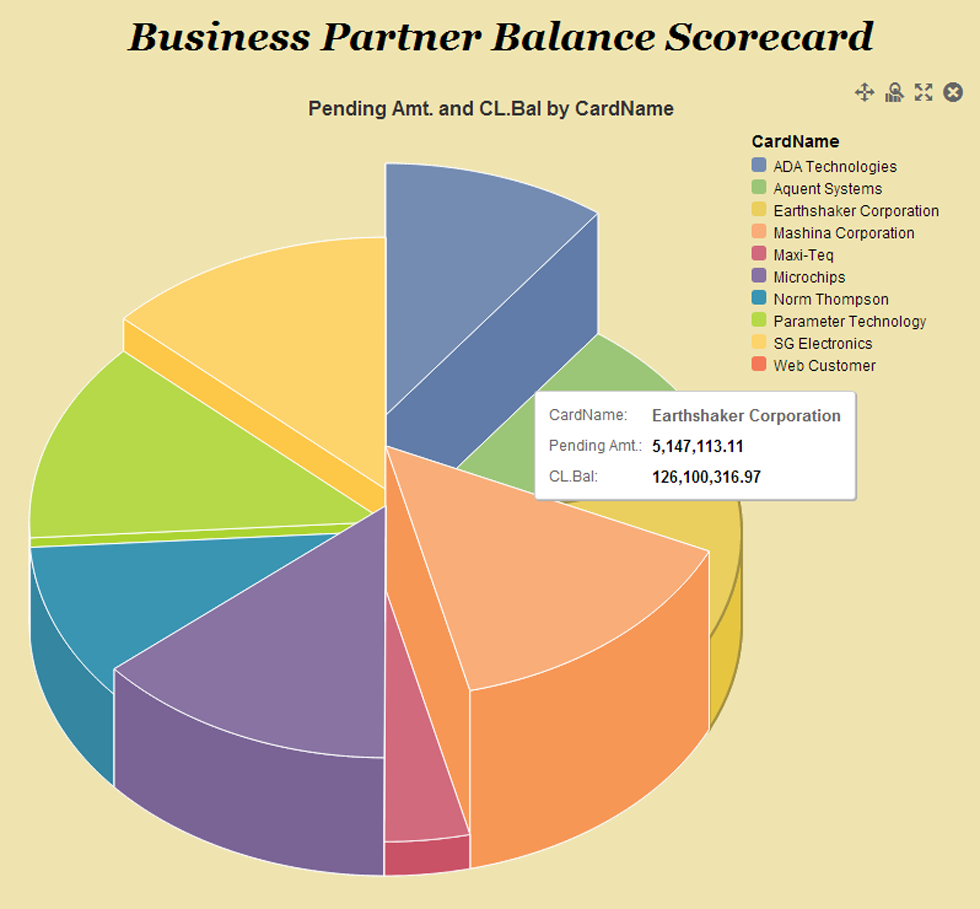
Visual options are the handsome reason for starting Lumira. It has the ability to add text, images, shapes, pictograms, and input controls via simple drag-and-drop functionality. The extremely neat and best intuitive interface makes creating visually nice and instructive charts easy for end-users, even for those who don’t lack experience. A powerful element within Lumira is the visual representation of data or information. This can be used to make info graphic, non-interactive narratives, such as newsletters, which can be effortlessly absorbed by the viewer at a glance.
Preparing Data
Naturally, the idea behind this tool is that it will lower IT time and costs, because the end users will be preparing the data themselves. For example, business users can add formulas, create time and geographical hierarchies, merge data sets, create measures, clean and format data, and more in a few simple steps, without any coding or scripting.Sharing Information
By providing BI self-service, collaboration and accessibility, Lumira gives multiple, easy-to-use options for sharing documents and datasets. Currently, Lumira files and datasets both can be published to Lumira Cloud, Lumira Server, or the SAP BI server.Geo Map Service
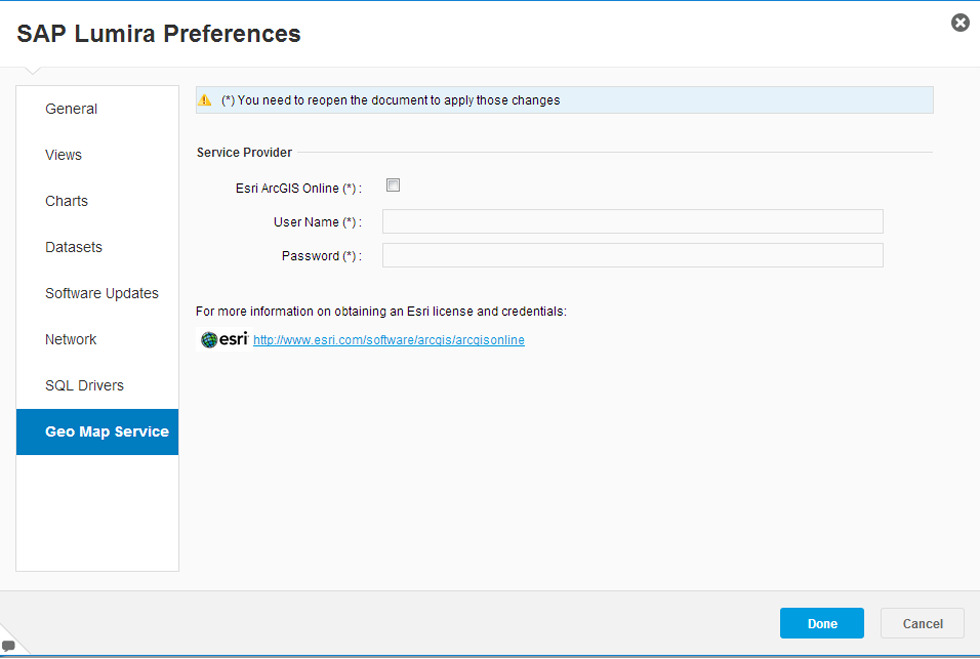
ArcGIS allows users to collect, use & organize the map data. Maps integrated with SAP Lumira enables mapping for geo business data. Users can even mash up data and maps shared by others highlighting chat, photos and web pages along with exporting this map to excel and PowerPoint. Developers can build customized maps using Esri cloud based services. Users can use data from anywhere at any time without any location bias.
Enriching your Data (Cleaning, Deleting, Sorting, Filtering and formatting)
- Building visualization for datasets
- Sort, Filter and Rank values in visualization
- Changing the chart formatting
- Adding text and images in story board